
Background and overview
The survey was designed to give an overview, to understand the current experiences of delivering care and support. We have been able to pull out the high level messages across the three sub-sectors and some job roles.
Limitations of this data
The survey questions needed to be broad enough to relate to the entire workforce, but specific enough to attain useful results. Some questions achieved this, but not others. We’ve tried to be honest about the limitations so that you can make the best use of these findings.
Please consider the following:
- The findings are not representative of the whole workforce. The response rate from the private sector is small (6%) when compared to the size of the sector in Scotland (the private sector currently employs around 82,510 people, 41% of the total social services workforce). The response rate from the statutory sector is large (69%) compared to the size of the sector in Scotland (the public sector currently employs around 62,600 people, 31% of the total social services workforce). Please see the 2014 SSSC workforce data report for more information.
- This project attempted to understand the experiences of the social services workforce in Scotland. However the sample was predominantly made up of social workers (32%). There are a variety of other job roles that are not well represented, particularly care staff (according to SSSC workforce categories).
- The figures relating to zero hour contracts and the living wage likely to be lower than actual sector averages. The SSSC workforce data report estimates that approximately 10% of the workforce are on a zero hour contract. CCPS and Scottish Care have both highlighted the challenges of implementing a living wage in their recent reports see the CCPS Benchmarking report 2014
- 23% of respondents did not complete the final section of the survey. This drop out rate made segmentation of the results difficult. As a result, we’ve been unable to make substantive comparisons across service type and geographical area.
- Respondents were given the option to skip any question. This made it difficult to find significant differences or similarities for some of the questions. For example, we can’t compare responses from people providing adult support and protection with those who work in residential care. We also can’t compare one local authority area with another.
- The survey did not ask respondents to identify the organisations that they work for and so it is not possible to say how many separate organisations were involved.
Following an initial discussion with Scottish Government, an in-house evaluator at IRISS and experts at The Guardian, an online questionnaire to survey the Scottish Social services workforce was created. This questionnaire was tested with 4 IRISS Champions, as well as other critical friends working within the social care sector. The questionnaire contained 22 questions and 3 broad areas/themes. These are:
- Section 1: about you (including questions relating to length of time in profession, motivation to stay in profession, pay and workload)
- Section 2: about your experiences (including questions relating to how people feel in their role, the extent to which they can support outcomes to be met, their perceptions of how their organisation is performing in the current climate, challenges and opportunities)
- Section 3: what’s important to you (included questions on how people feel valued, how they engage with learning, policy and how they can effect change)
- Section 4: demographic information (included questions to enable understanding of who had taken part in the survey (including age, gender, role, location and type of work undertaken by respondents).
Iriss also reviewed a number of sector surveys to avoid duplication. However, it was considered that as many other surveys are focused on one particular area of the workforce, to some extent the ambition to enable comparison across the public, private and voluntary sector some repetition would be helpful.
Sampling
The aim of the survey sampling was to distribute the online survey as widely as possible within the social care workforce. We were keen to ensure that a broad range of respondents was reached. In order to maximize the reach, the following links were made:
- The survey was predominantly placed on the Guardian Social Care Network homepage and continually promoted through their twitter and newsfeeds.
- The survey was sent to all 54 IRISS Champions for dissemination. IRISS Champions operate within each local authority area in Scotland, in large third sector organizations and in some private sector organizations.
- Distributed through Scottish Social Services Council (SSSC), Scottish Care, Coallition of Care Providers Scotland (CCPS), Social Care Ideas Factory (SCIF), CELCIS, The Alliance, Scottish Community Development Centre (SCDC), Care Inspectorate, Joint Improvement Team (JIT), British Association of Social Work (BASW), Scottish Organisation for Practice Teachers (SCOPT), Chief Social Work officers, Scottish Recovery Network Peer Support Network, a group of frontline support workers (engaged in the qualitative side of this project).
The online survey was available 20 April 2016 and was closed on 30 June 2016. In that time, there were 2167 responses overall. 1678 were complete.
Respondent profile
It should be noted that 23% of respondents did not complete the demographic section of the survey.
Gender
Significantly more females (74%) responded to the survey than males (26%). This is aligned with the profile of the Scottish social care workforce.
Age
Over half of respondents (57%) stated that they were between the ages of 35 – 45, 18% were between ages 18-34, and 24% were between the ages of 55-75.
The type of organisations respondents work in
The statutory local government and health sector counted for the largest percentage of respondents (69%), with smaller representation from the third (25%) and private (6%) sectors.
Where do respondents provide services?
There were responses from those providing care and support in every local authority area in Scotland with noteworthy contributions from those working in Edinburgh City (25.02%), Glasgow City (10.42%) and Fife (9.39%).
Adults or Children’s services
62% of respondents stated that they worked in Adult Services. This was broken down into a range of different duties where respondents were able to choose more than one category and in three different settings (at home, in the community and in a residential setting). The predominant choice selected was adult support and protection.
24% of respondents stated that the predominantly supported children and young people, and their job role breakdown is as below. The two key roles represented in the sample were: children and families social work and looked after children (accommodated at home or accommodated away from home).
It should be highlighted that there were some respondents who felt unable to select an appropriate category. 14% respondents left comments relating to the fact that their work was not focused on any particular client group. In general, these respondents were providing learning and development/education support, or more generalist services such as welfare rights, occupational therapy and citizens advice. Approximately 10 respondents used their comments box to highlight that they provide support across both adult and children services.
Job role
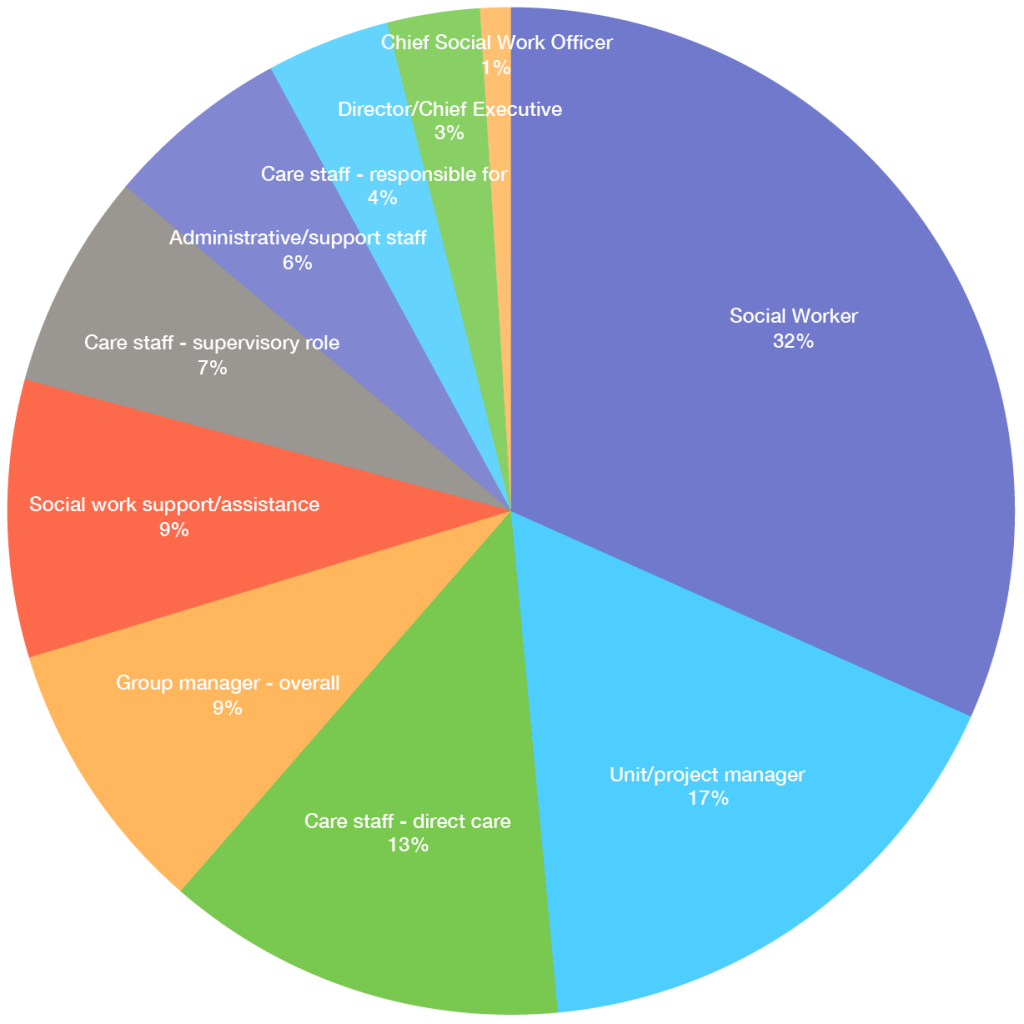
Respondents were asked to select the category (based on SSSC terminology) which best described their role Please note that infographics displaying the key findings from the survey
2,167 people responded. 1,678 provided complete responses.
Working conditions
- only 4% stated they were paid under the living wage
- only 2% were on zero hour contracts
- 62% had worked in the sector for more than 10 years.
- Those who had been in the sector longest (16+ years) had only had 1 post in the past 5 years
- 62% reported doing additional work most weeks, only 7% said that they ‘never’ work over their contracted hours. NB: those on zero hour contracts were removed from this sample
Motivations
- 75% said they were driven by a desire to make a difference
- 57% of respondents said that their work matched their personal values. This was more pronounced in the voluntary sector, where 65% of the sample cited this reason.
- 78% said they were happy – those who’d worked in the sector for over 20 years were more likely to strongly agree that they are happy (36%). Those who said they’d worked in the sector for 11- 15 years were less likely to say that they were happy (25%)
Challenges
- funding cuts are the biggest challenge faced by the sector as a whole, with 48% of the whole sample citing this reason
- 87% of all respondents reported that they’d seen a reduction in the availability of social services support for people
- statutory sector organisations feel the most tension between what people want and what they can deliver (82% compared to 48% in the private and voluntary sectors)
- Top challenges for the statutory sector were high workloads (49%), funding cuts to services (45%) and bureaucracy and red tape (38%)
- Top challenges for the voluntary sector were funding cuts (61%), high workloads (44%) and staff shortages (40%)
- Top challenges for the private sector were staff shortages (54%), funding cuts (44%) and low morale (41%)
- 67% of respondents perceived an increase in service redesign in the past year. This was reported most frequently by statutory services and group managers.
Opportunities
- overall organisational capacity to improve outcomes had stayed the same
- 82% of voluntary sector respondents and 74% private sector respondents ‘always’ or ‘often’ reported that their organisation was able to provide preventative services. This was compared to only 55% in the statutory sector.
- creativity and innovation is happening across the sectors but is more frequently reported in the voluntary (49%) and private sectors (42%)
- across the sample respondents reported that they are ‘often’ able to be evidence informed (83%) and are able to actively seek good practice (74%) in their organisations.
- the majority of respondents (55%) perceived that their organisation’s ability to create community connections had stayed the same. 29% said that there had been an increase
- respondents in the statutory sector reported an increase in partnership working more frequently. When compared across job role, social workers and care managers perceived that partnership working had remained the same.
What makes the workforce feel valued
- 70% of respondents say good outcomes for the people they support make them feel valued
- 64% said that positive feedback from people supported by services makes them feel valued
- 77% perceived that they were always or often provided with effective support and supervision
- 74% of respondents said that they had the opportunity to attend training of interest to them and that supports them in their work
- 42% respondents make time out of work to study
- respondents from the private sector were more likely to say that they were sent on training (50%)